Job Salary Prediction — Exploratory Data Analysis
A comprehensive overview investigating the interplay between salaries, education levels, experience, and different job features within the labor market.
Dataset Overview
Sample Rows
Data Types & Missing Values
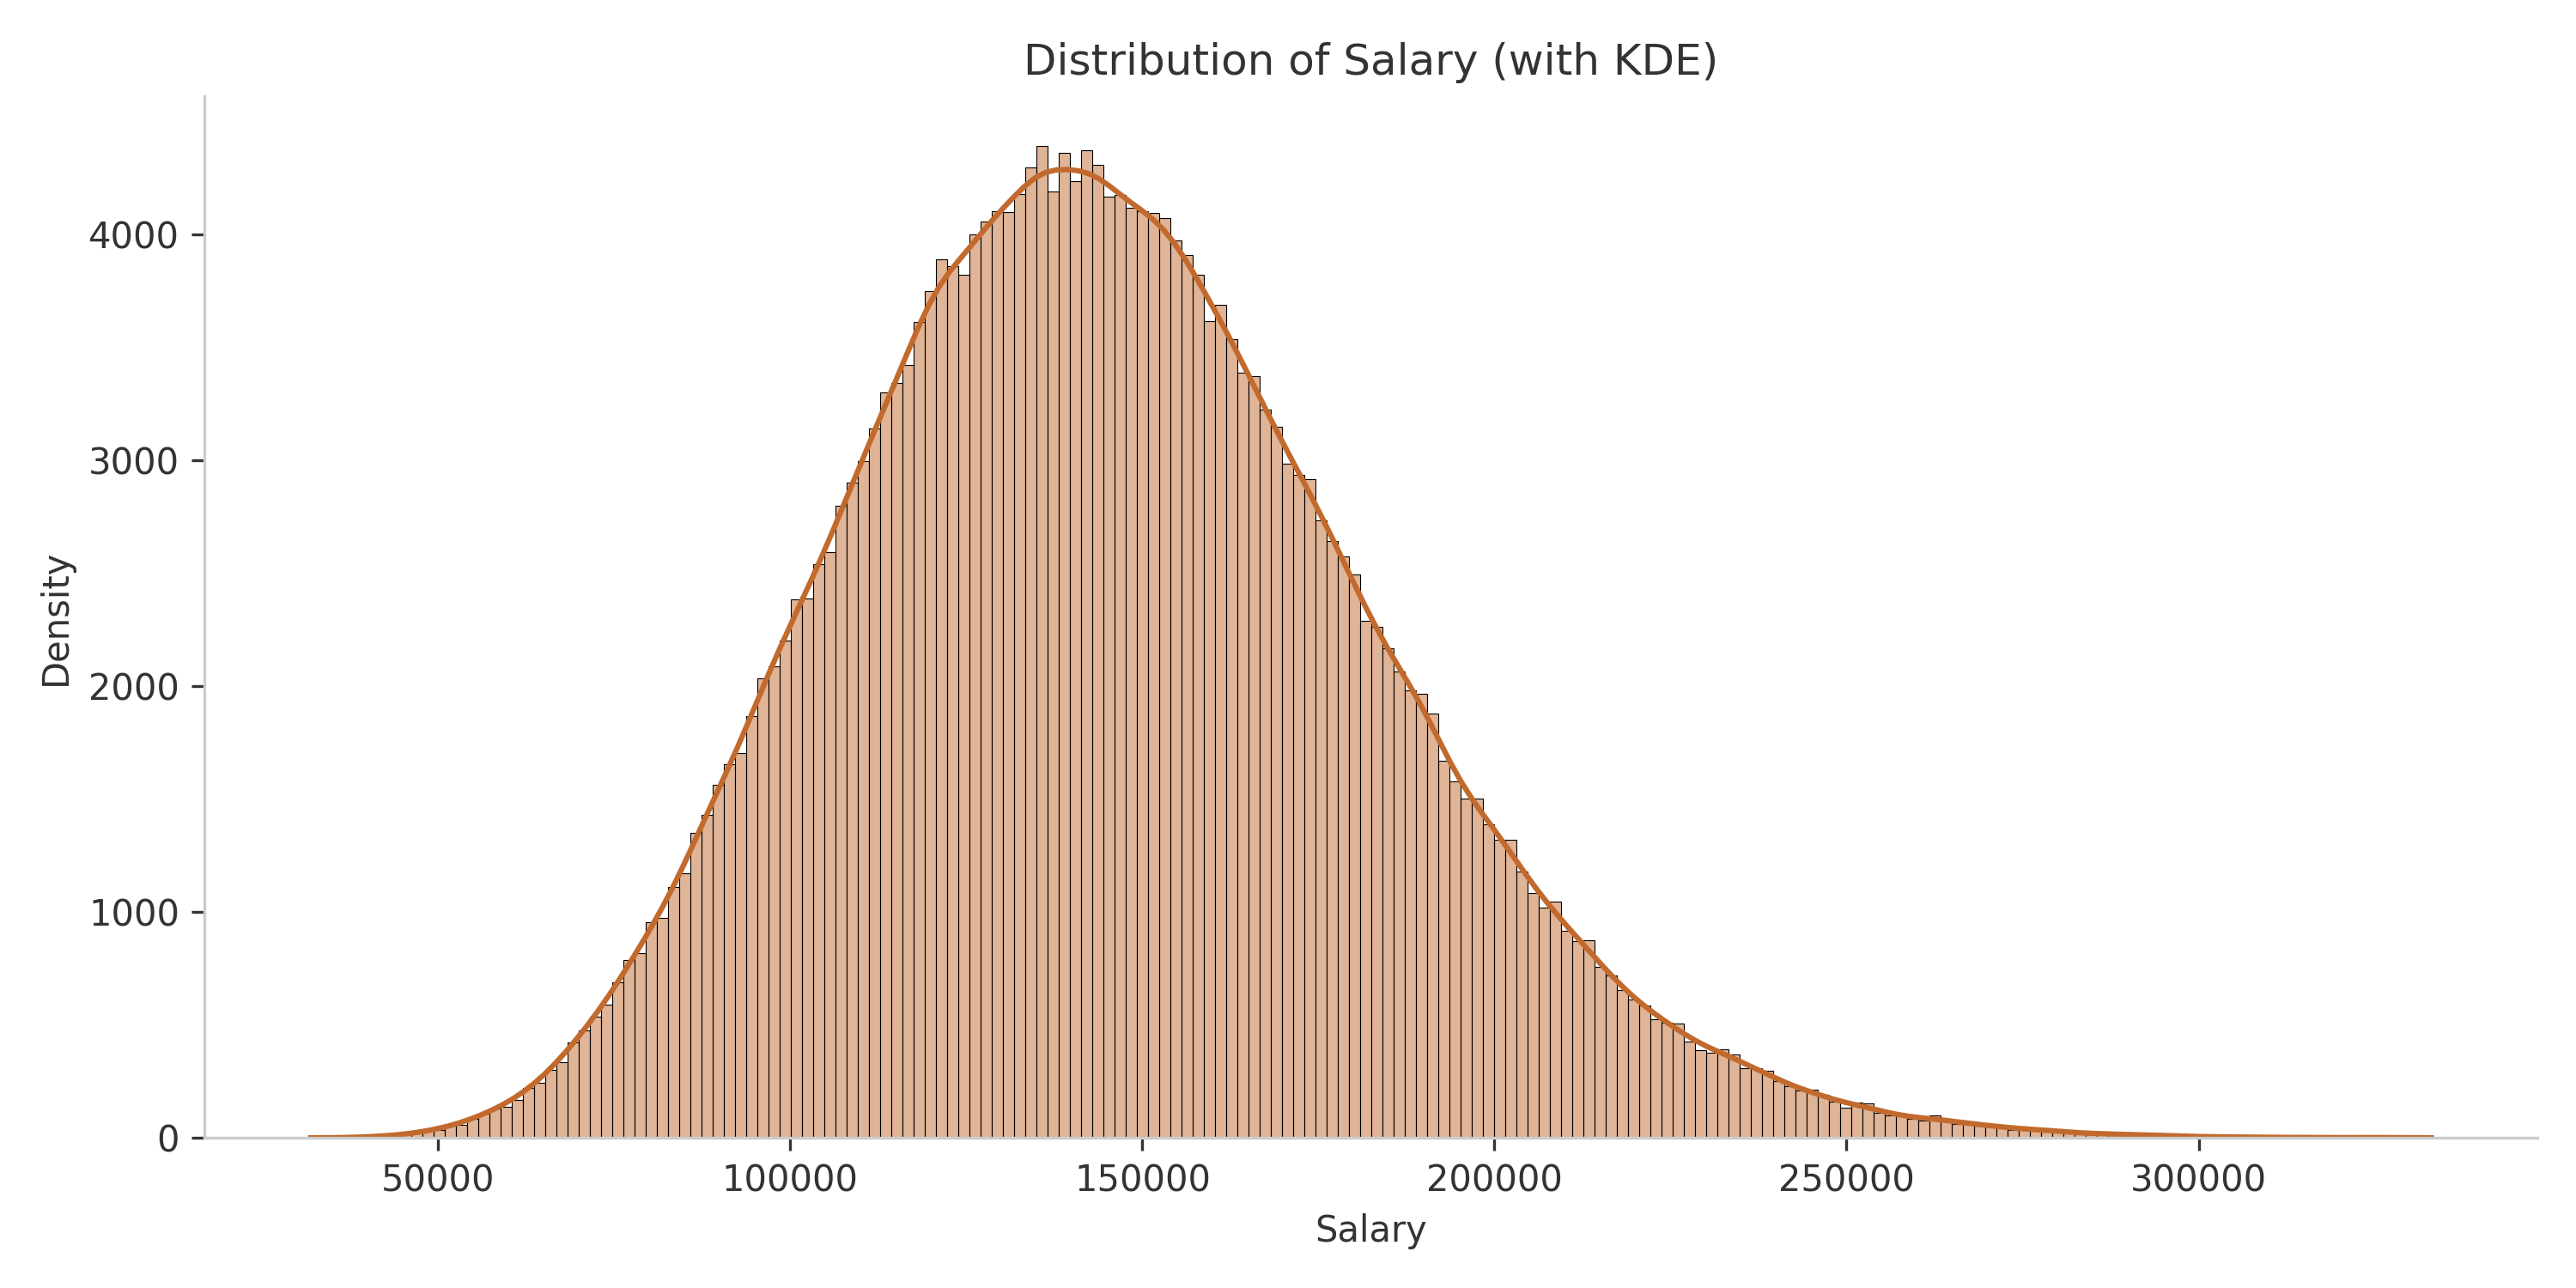
Salary Distribution
Insights
The salary distribution exhibits a right-skewed pattern, heavily concentrated in entry-level to mid-range brackets. The presence of a "long tail" at higher income levels reflects the scarcity of senior or C-level positions in the labor market.
Hierarchical Factors (Education & Company Size)
Insights
Education: Advanced educational degrees (Master's or PhD) raise the median salary and considerably widen the variance, confirming they are often tied to highly specialized or strategic management roles.
Company Size: Enterprise and Large companies consistently offer higher compensation bands and greater salary ceilings compared to Startups and Small businesses.
Multivariate Interaction Analysis
Insights
By crossing Education Level with Company Size, we observe nuanced salary boundaries. For instance, obtaining a higher degree (Master/PhD) effectively multiplies earning potential significantly more within Enterprise environments than in Startups.
Role & Industry Benchmarks
Insights
Job Titles: Specialized or technical roles typically command higher median salaries, indicating market demand for niche technical skill sets over generalist positions.
Industries: High-margin sectors like Finance and Technology strongly dominate the top-paying tiers, reflecting their reliance on data-driven or tech-savvy professionals.
Category Frequency & Class Imbalance
Insights
This dual-axis chart maps the frequency capacity underlying median salaries. The blue bars confirm that this dataset is highly stratified and perfectly balanced (~20,000 records per job title). This uniform distribution is an ideal scenario for Machine Learning, as it systematically eliminates Class Imbalance risks and ensures the model will not become biased toward any single dominating majority class.
Work Environment & Location
Insights
Remote Work: Fully remote and hybrid roles frequently capture competitive salaries matching or exceeding traditional on-site jobs, suggesting strong remote compensation parity.
Location: Developed markets (e.g., USA, UK, Germany) showcase a significantly higher baseline for compensation due to elevated living costs and robust talent ecosystems.
Experience vs Salary Tracking
Insights
The scatter plot illustrates a strong, positive linear relationship between years of experience and salary. As experience increases, compensation consistently trends upward, reaffirming that seniority and time in the industry are among the most reliable predictors of higher earning potential.
Feature Correlation & Independence Matrix
Numerical Correlation (Pearson)
Categorical Correlation (Cramér's V)
Insights
Numerical: Years of experience maintain the strongest linear correlation with
overall salary, whereas skills or certifications act as competitive catalysts but not primary
drivers.
Categorical: The Cramér's V heatmap reveals that all correlation values are near zero (< 0.05). This confirms there is absolutely no categorical redundancy or overlap in the dataset. All 6 features are completely independent and can be safely utilized together in the Machine Learning training pipeline without any risk of multicollinearity.
Executive Summary: Salary Drivers
Based on the comprehensive Exploratory Data Analysis (EDA) and Statistical Testing (Pearson, Cramér's V) performed, we conclude that the following core factors shape compensation in the labor market:
- Linear Drivers:
Years of Experiencestands as the most robust baseline metric. Compensation scales linearly and consistently with active field experience, vastly overshadowing surface-level factors like the sheer count of skills or certifications. - Exponential Multipliers: Holding an
Advanced Degree (Master's/PhD)combined with working at anEnterprise-scale Companycreates a massive leverage effect. These factors do not just bump the baseline salary - they dramatically stretch the salary ceiling to dimensions exclusively reserved for senior management and highly specialized domains. - Role & Industry Specifics: Positioning oneself in high-margin sectors (Tech, Finance) or securing niche, highly technical roles (Data Scientist, ML Engineer) fundamentally guarantees a much higher income baseline compared to generalist positions.
- Work Environment Parity: Data thoroughly
debunks the remote-work "pay cut" myth.
Remote/Hybridprofessionals are capturing compensation packages strictly equal to, if not exceeding, traditional On-site workers. Additionally, securing roles stationed across developed Western markets (USA, Canada, EU) serves as a rigid guarantee for top-percentile salary tiers.
Data Modeling Directives (Phase 2)
Transitioning into the Machine Learning phase, models must be configured to prioritize primary pillars (Experience, Education, Company Size). Fortunately, our analysis confirmed that Job Titles are perfectly stratified (~20k records each), completely eliminating Class Imbalance risks and providing an ideal foundation for training robust, unbiased algorithms.
Model Engineering Recommendations
- Target Encoding: Instead of massive One-Hot arrays, use Target Encoding or Frequency Encoding for complex Nominal columns like Job Titles or Industries.
- Algorithm Choice: Due to the non-linear "exponential multiplier" effects observed (e.g. Master's in an Enterprise), tree-based algorithms (XGBoost, LightGBM) will heavily outperform standard Linear Regression.